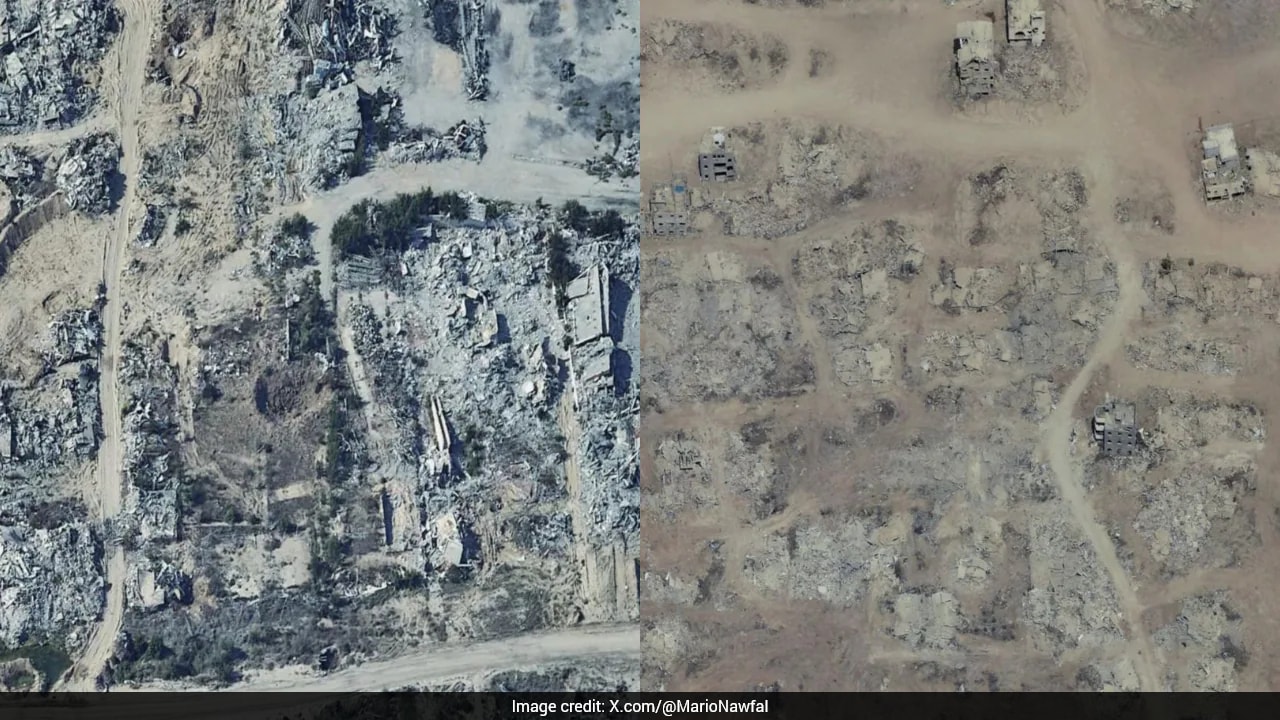
Spatial data platforms operate as passive witnesses to systemic conflict, transforming high-resolution satellite telemetry into an objective record of structural erasure. Recent updates to consumer-facing mapping archives, such as Google Maps and Google Earth, replace outdated topographical profiles with contemporary captures of the Gaza Strip, rendering the mechanics of modern urban warfare quantifiable to the global public.
This visibility shifts the analytical paradigm from localized casualty accounting to macro-scale spatial forensics. Evaluating the updated cartographic data requires dissecting the operational mechanisms driving the physical transformation of the territory, the economic toll of systemic demolition, and the limits of civilian infrastructure recovery. Also making headlines in related news: Why California Beaches Are Disappearing Faster Than You Think.
The Three Vectors of Structural Attrition
The transformation visible across municipal borders in northern hubs like Beit Hanoun and Jabalia, as well as southern corridors in Rafah, reveals a pattern distinct from random munitions dispersal. The mechanics of destruction follow three distinct operational vectors:
- Precision aerial bombardment targeting high-density multi-story residential blocks and municipal hubs.
- Systematic engineering demolition via heavy track-laying excavators and controlled explosive placement, specifically deployed to clear buffer zones and secure infrastructural corridors like the Netzarim corridor.
- Secondary clearance operations aimed at neutralizing defensive sniper positions, which systematically reduces adjacent supporting structures into contiguous fields of particulate rubble.
Satellite verification indicates that damage distribution is non-random. Industrial zones, agricultural land in Khan Younis, and civic centers such as the Rimal neighborhood in Gaza City exhibit complete asset devaluation. The physical footprint of neighborhoods has been replaced by linear tracks of cleared earth and packed tent clusters, mapping out an enforced spatial reorganization of the surviving population. More details into this topic are covered by The New York Times.
The Macroeconomic Cost Function
The quantifiable outcome of this kinetic activity is defined by structural collapse across multiple socio-economic indices. According to assessments by the United Nations Satellite Centre (UNOSAT) and associated international bodies, the macro-level indicators establish a baseline of complete systemic failure:
- Structural Damage Ratio: Over 80 percent of all physical structures within the enclave have sustained varying degrees of structural compromise, with primary urban centers exceeding 85 percent degradation.
- Displacement Density: Approximately 1.9 million to 2.1 million individuals remain internally displaced, compressing urban populations into narrow coastal strips and humanitarian zones like Al-Mawasi, which have transitioned from open agricultural acreage to hyper-dense encampments.
- Debris Volume Metrics: Debris estimates scale past 60 million tonnes of particulate rubble—a volume multiple times larger than comparable urban conflicts of the past two decades. This mass contains unexploded ordnance, hazardous industrial contaminants, and unrecovered human remains, creating a profound logistical hurdle for any future engineering intervention.
The economic contraction of the territory exceeds 80 percent, effectively reversing decades of local capital accumulation and development. The destruction of institutional hubs, university campuses, electrical sub-stations, and water sanitation facilities transforms the territory into an environment incapable of sustaining baseline autonomous economic productivity.
Information Latency and Remote Sensing Limits
While consumer mapping updates provide undeniable visual confirmation of wide-scale razing, relying on commercial satellite interfaces introduces analytical limitations that must be accounted for:
- Temporal Lag: Commercial providers operate on capture cycles that can lag behind ground-level realities by months. Data reflecting a specific quarter often captures an intermediate phase of a protracted military operation rather than an immediate status.
- Resolution Constraints: Standard optical imagery identifies macro-level structural flattening, roof collapses, and clearing lines, but fails to quantify sub-surface damage, tunnel network integrity, or structural compromise in buildings that retain an outwardly intact facade.
- Metadata Discrepancies: Archival indexing errors within consumer platforms frequently misattribute capture dates, requiring analysts to cross-reference historical overlays with radar data and specialized remote sensing agencies to establish chronological accuracy.
Recognizing these constraints prevents the misinterpretation of cartographic data as a real-time tactical dashboard. Instead, the maps serve as a retrospective ledger of systemic de-urbanization.
Strategic Forecast and Remediation Bottlenecks
The transition from active kinetic engagement to post-conflict management presents a series of severe logistical bottlenecks. The sheer volume of rubble combined with hazardous material dispersion means that site clearance alone will require specialized heavy machinery, multi-year timelines, and billions in capital investment before structural rebuilding can commence.
Logistical planners must prioritize three sequential phases: unexploded ordnance mitigation, environmental decontamination of water tables compromised by ruined infrastructure, and systematic waste sorting to separate recyclable aggregate from toxic particulate matter. Until these baseline remediation thresholds are cleared, the spatial configuration visible via satellite—defined by tents, debris fields, and erased street grids—will remain the structural reality of the region.