A surge in reported nuisance behaviour on Hong Kong public transport does not automatically prove that commuters have suddenly become less civil. In dense transit networks, complaint totals measure a compound signal: actual behavioral friction multiplied by propensity to report, channel accessibility, and institutional enforcement visibility. Understanding this gap separates headline alarmism from operational reality. This analysis sets out a diagnostic framework for evaluating transit nuisance reports, mapping the mechanics of crowding and norm breakdown, separating verified facts from working hypotheses, and outlining practical interventions along with their limits.
To analyze a multi-year rise in transport nuisance complaints without falling into circular commentary, treat each recorded report as the output of an reporting function rather than a direct headcount of bad acts. Two distinct shifts can move the number upward even when baseline conduct is unchanged. First, reporting friction often drops when operators add quick in-app reporting buttons, QR codes on carriages, or WhatsApp hotlines. Lowering the effort required to file a complaint naturally captures incidents that previously went unrecorded. Second, perception shifts when commuters experience sustained crowding or see viral clips of anti-social conduct, which lowers the threshold at which a rider decides an annoyance crosses the line into a formal complaint.
Conceptual Frameworks for Transit Nuisance
Standard reporting on transit complaints rarely separates structural conditions from individual choices. A clearer diagnostic model organizes the problem around three interacting mechanisms: the Crowding-Friction Curve, the Norm-Enforcement Loop, and the Complaint Funnel.
The Crowding-Friction Curve
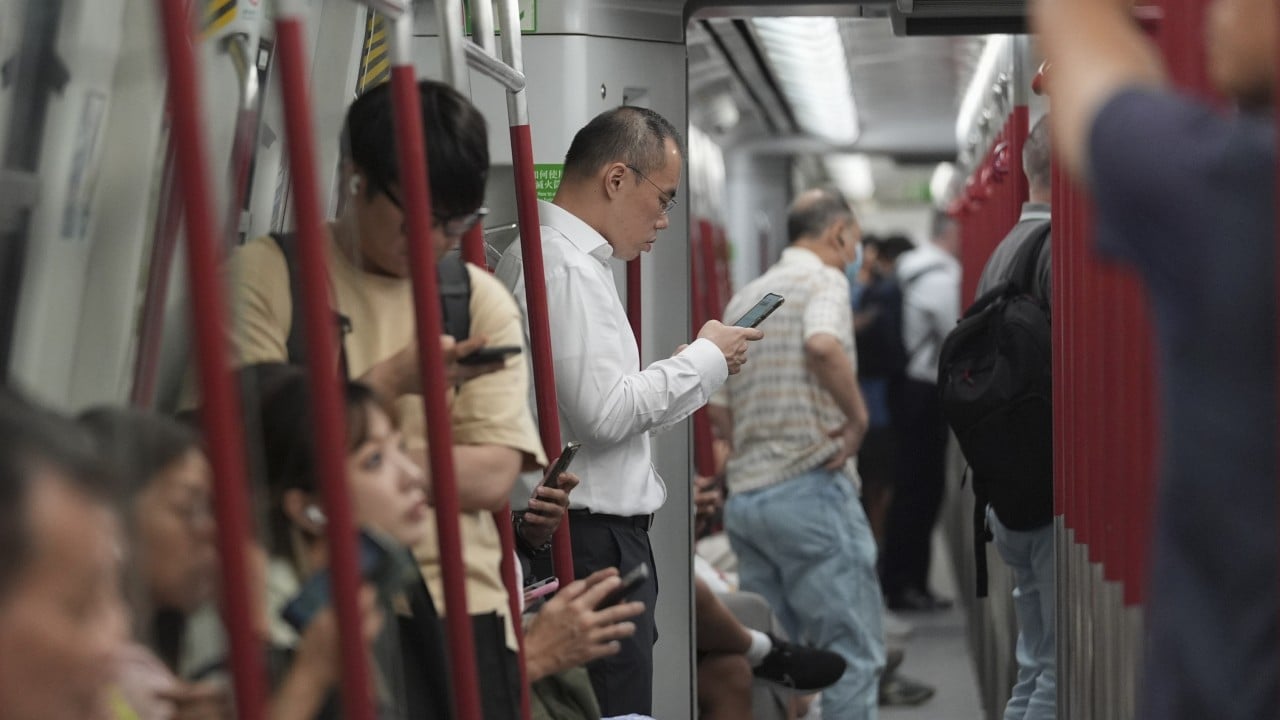
High-density transit operates near physical tolerances where small spatial deficits produce outsized interpersonal friction. When passenger load rises past comfortable standing density, personal buffer zones collapse. Actions that are harmless in a half-empty car—swinging a heavy backpack, stretching legs into an aisle, speaking at normal volume on a phone call, or eating strong-smelling food—suddenly invade another person's physical or sensory space.
The operational bottleneck here is non-linear. Below a moderate occupancy threshold, minor irritations are easily avoided by moving to another seat or another section of the train or bus. Above that threshold, avoidance requires effort or is physically impossible. A single awkward posture or unrestrained bag affects dozens of adjacent riders simultaneously, turning isolated habits into shared stressors.
The Norm-Enforcement Loop
Shared spaces rely on informal social norms backed by visible rules and credible follow-through. When riders observe norm violations going unaddressed—such as loud audio played without headphones, feet on seats, or blocking doors—two cascading effects occur. Observers infer that the rule carries low practical cost, and some become more willing to bend rules themselves, especially when tired or rushed.
Conversely, visible, consistent intervention reinforces expectations across the entire cabin. That intervention does not have to be punitive on every occasion; clear signage, timely announcements, and occasional staff presence remind riders that the space is actively governed. When visible enforcement lags behind peak-hour strain, informal norms erode faster than formal rules can be written.
The Complaint Funnel
A formal complaint sits at the end of a narrowing funnel:
- Exposure: A rider experiences or witnesses conduct perceived as disruptive.
- Threshold crossing: The rider judges the incident severe enough to warrant action rather than tuning it out or moving away.
- Channel activation: The rider finds a reporting path—such as a mobile app, station staff, hotline, or online form—and has the time and patience to submit details.
- Classification: The operator logs the submission under a nuisance or conduct category.
Changes at any single stage alter the final tally. A spike in recorded complaints can reflect wider exposure during peak travel, a lower threshold driven by commuter fatigue, or smoother channel activation after a digital update. Without distinguishing those stages, operators risk misallocating staff to the wrong time of day or the wrong complaint type.
Facts Versus Working Hypotheses
Careful analysis requires separating established structural realities of high-density transit from hypotheses that need operational data to confirm. Because no full source text or granular dataset accompanies the headline reference, any specific breakdown of incident types or year-over-year percentages remains outside confirmed facts here.
Known Structural Facts
- High spatial density compresses tolerances: Urban rail and bus systems move large volumes in tight quarters, meaning minor spatial or acoustic intrusions affect many people at once.
- Complaint counts reflect reported events, not total occurrences: Many minor annoyances are absorbed silently, while some incidents may be reported by multiple witnesses or misclassified across categories.
- Reporting channels shape data volume: Accessible digital reporting lowers barriers to submission compared with seeking out staff or filing written feedback.
Working Hypotheses to Test
- Post-recovery volume and crowding strain: As travel patterns normalize and peak or shoulder periods tighten, higher passenger loads may be pushing more carriages into the zone where minor habits trigger friction.
- Lower reporting friction: Easier mobile or messaging reporting tools may be converting latent frustration into formal logs at a higher rate than three years ago.
- Heightened sensitivity to sensory and spatial intrusions: Prolonged urban stress and crowded commutes may be lowering riders' patience for noise, bag placement, and seat hogging.
Hidden Cause-and-Effect Chains
Surface-level commentary often treats nuisance behaviour as a simple matter of manners versus rudeness. Looking closely at system dynamics reveals cause-and-effect chains that are easy to miss.
How Crowding Distorts Boarding and Alighting
When carriages near the doors are packed, riders near the center of the car sometimes hesitate to push toward the exits early, or riders on the platform crowd the doorway before alighting finishes. Dwell times lengthen slightly at busy stations. Longer dwell times ripple down the line, compressing headways or increasing crowding on the next arriving train or bus. Frustrated, compressed passengers are quicker to perceive nearby riders as inconsiderate, even when spatial layout and flow timing are doing much of the work.
Why Viral Clips Skew Perceived Frequency
Short videos of extreme altercations or egregious behaviour travel fast on social media and local news. Even if dramatic confrontations remain rare compared with routine daily trips, repeated exposure makes extreme scenarios feel common. Commuters entering a crowded cabin with heightened vigilance are more likely to interpret ordinary friction—a bump, a loud call, an unmoved bag—as deliberate hostility, raising both tension inside the vehicle and the likelihood of a formal report.
The Staffing Trade-Off During Peak Hours
Transit operators face a classic allocation trade-off: deploying customer service officers or inspectors to high-complaint corridors during peak windows improves deterrence and reassurance, yet moving personnel toward complaint hotspots can leave other lines or off-peak windows thinner. If enforcement is concentrated only where complaints are already highest, emerging hotspots may go unchecked until they generate their own wave of reports.
Operational Playbook for Transit Operators
Addressing nuisance behaviour effectively requires pairing physical and digital design with targeted human presence rather than relying on generic public scolding campaigns.
- Audit complaint data by channel and time window: Separate reports submitted via quick digital channels from station or post-trip submissions, and map volume against passenger load and dwell-time metrics rather than raw daily totals alone.
- Design for spatial friction first: Use clear floor markings, handhold placement, and luggage/backpack reminders at pinch points so passengers have obvious cues on where to stand and how to keep aisles clear.
- Target high-leverage interventions to specific behaviours: Address noise through clear headphone reminders and zoned quiet/low-noise cues where feasible; address seat and space disputes through visible cabin circulation during peak hours rather than abstract slogans.
- Close the loop with riders: Provide brief, non-bureaucratic confirmation when a report is logged and publish transparent summaries of common issues and operational responses so commuters see that reporting leads to practical action.
- Calibrate tone to avoid backlash: Keep messaging matter-of-fact and practical; overly punitive or finger-wagging notices often alienate everyday riders without changing habits.
Limits and Trade-Offs
No single measure solves transit nuisance without trade-offs. Expanding easy reporting channels can inflate complaint numbers in the short term by capturing previously unreported friction, which looks worse on a headline chart even as visibility improves. Increasing staff patrols costs money and faces headcount limits, while overly aggressive enforcement can slow boarding or spark conflict inside crowded vehicles. Behavioral nudges work best when physical crowding is manageable; when a train or bus is packed past comfort, signage alone cannot create personal space.
A disciplined response treats a three-year high in nuisance complaints as an operational diagnostic signal, not a verdict on an entire city's character. The sharpest strategic move for a transit operator is to pair passenger-load and dwell-time analytics with targeted, high-visibility presence at peak bottleneck stations while tracking whether complaint growth is driven by rising crowding, lower reporting friction, or specific recurring behaviors.